Code-level application monitoring for OpenTelemetry
Take action on your telemetry data to resolve code issues faster - without multiple tools or complex instrumentation. Join the discussion here.
AMA: Getting Started with OpenTelemetry and Sentry
Getting Started is Simple
Grab the Open Telemetry SDK:
go get github.com/getsentry/sentry-go \ github.com/getsentry/sentry-go/otel
Configure your properties file:
import (
	"go.opentelemetry.io/otel"
	sdktrace "go.opentelemetry.io/otel/sdk/trace"

	"github.com/getsentry/sentry-go"
	"github.com/getsentry/sentry-go/otel"
	// ...
)

sentry.Init(sentry.ClientOptions{
	Dsn:              "__DSN__",
	EnableTracing:    true,
	TracesSampleRate: 1.0,
	Debug:            true,
})

tp := sdktrace.NewTracerProvider(
	sdktrace.WithSpanProcessor(sentryotel.NewSentrySpanProcessor()),
)
otel.SetTracerProvider(tp)
otel.SetTextMapPropagator(sentryotel.NewSentryPropagator())
Check our documentation for the latest instructions.
See all platformsMore than 100K Organizations Trust Sentry with Their Application Monitoring

Performance Monitoring that’s actionable, not academic
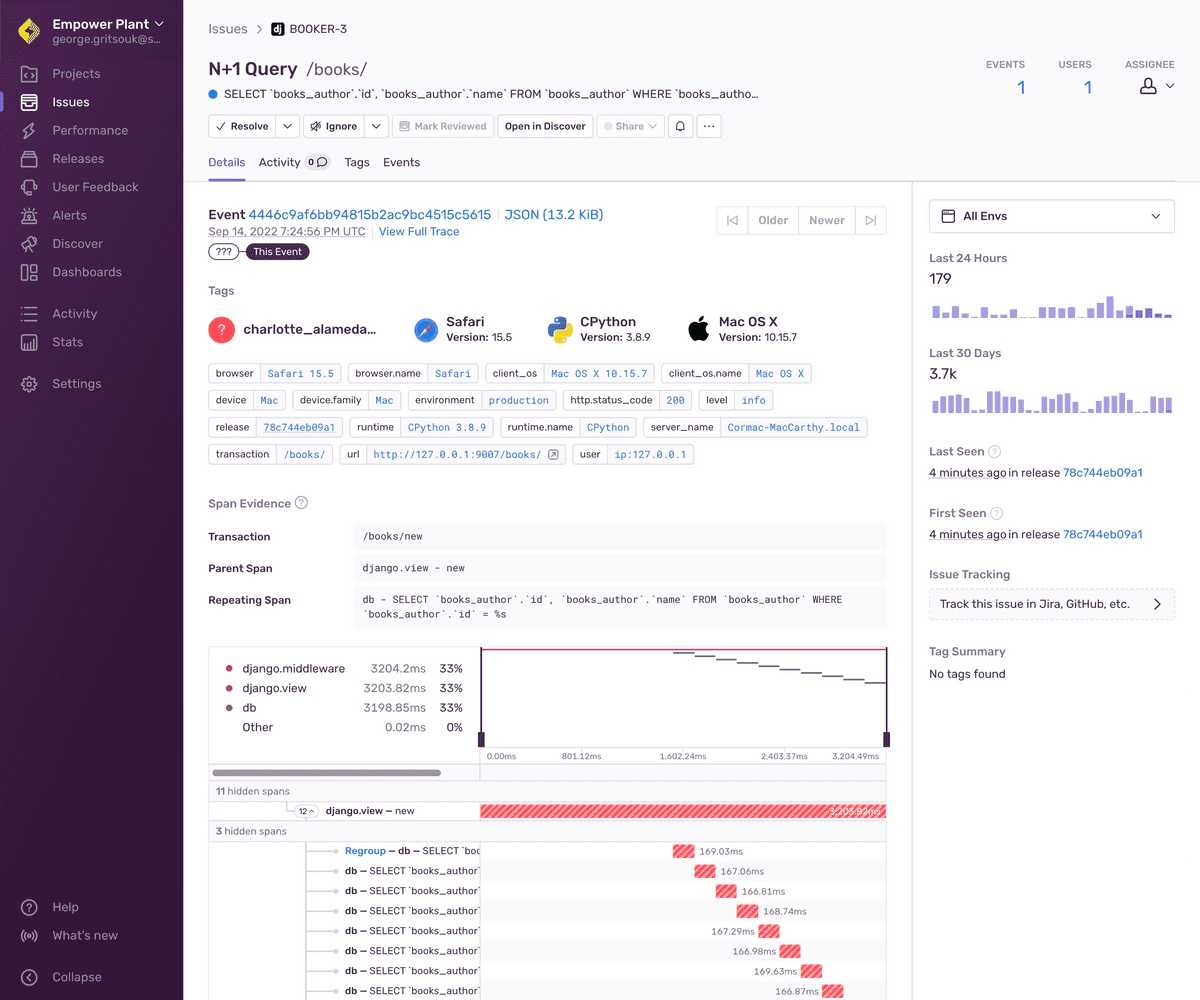
Focused on actionable feedback, not dashboards. Automatically detect issues for performance and errors and get to the fix faster with deep context - down to the line of code.

Fill in the blanks about your errors
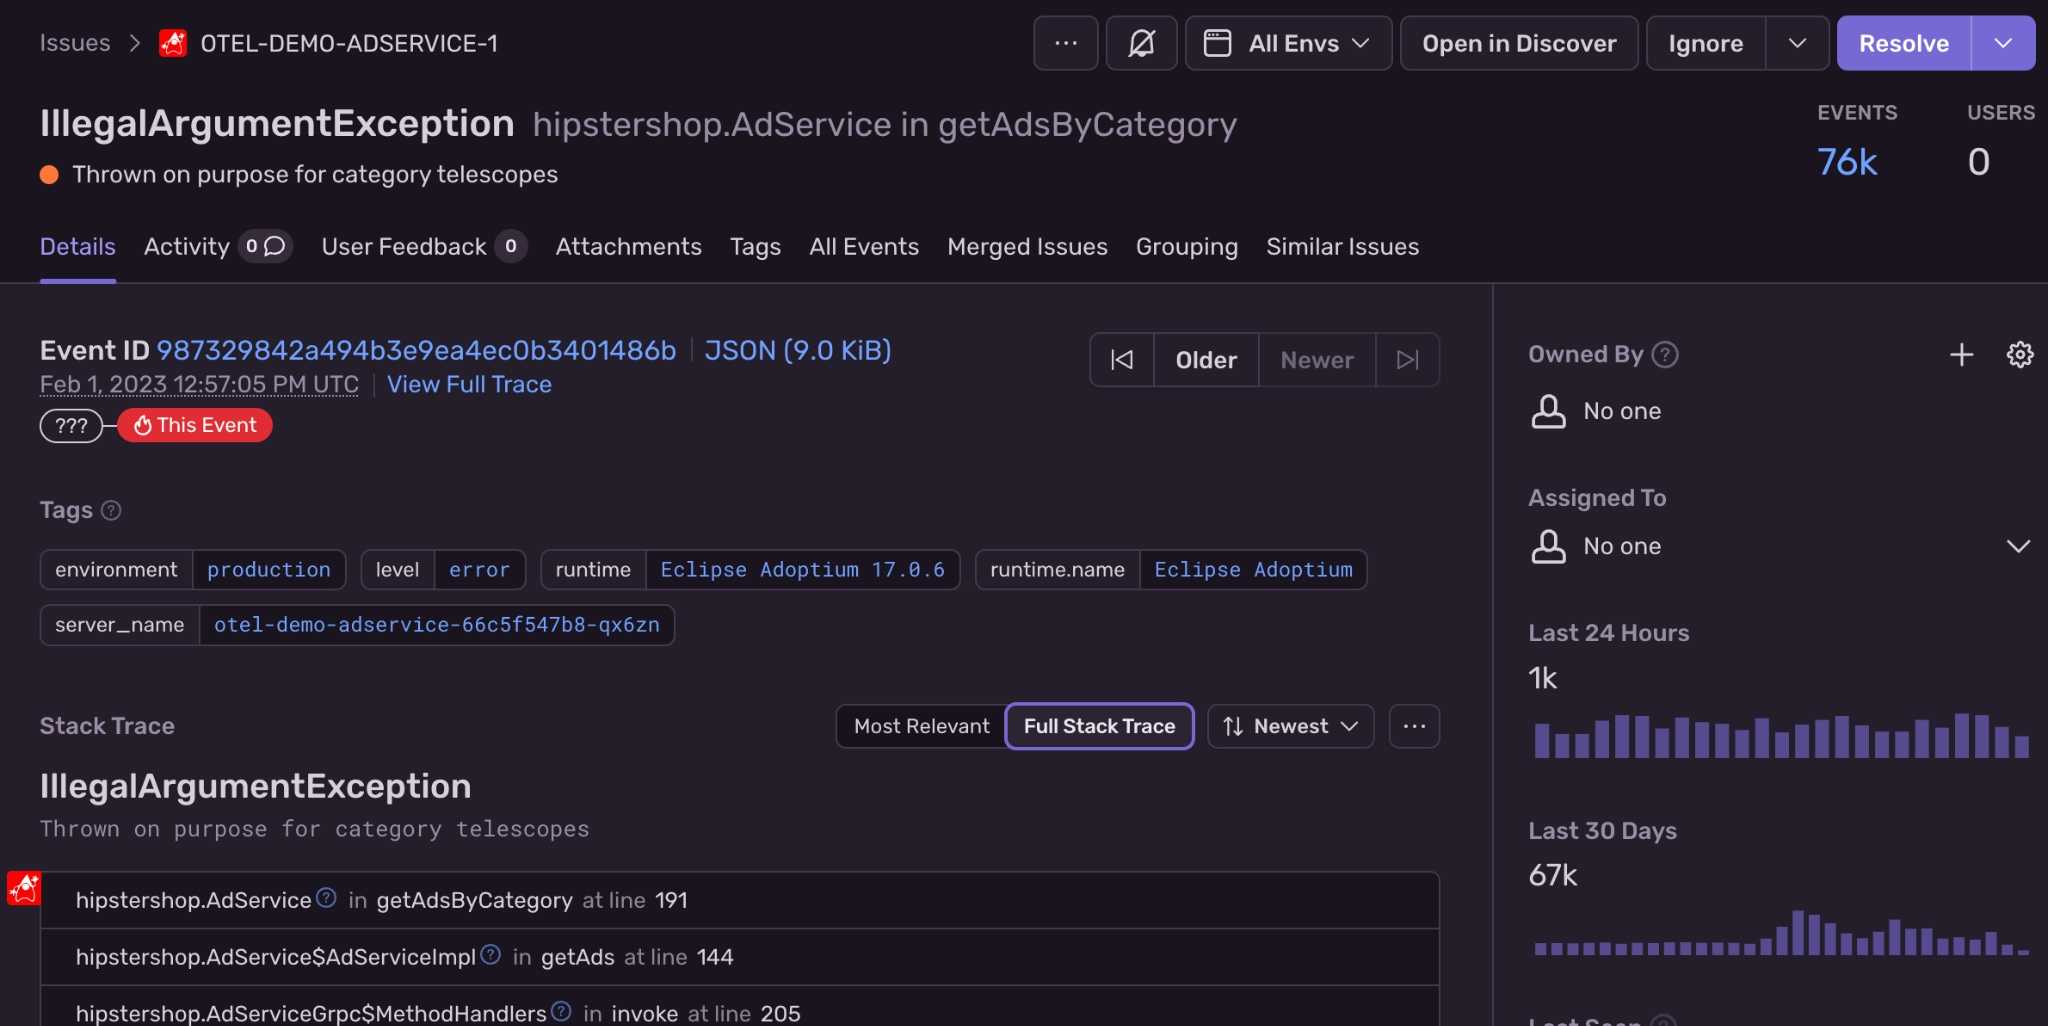
Expose the important events that led to each exception: SQL queries, debug logs, network requests, past errors. Improve debugging workflow with a full view of releases so you can mark errors as resolved and prioritize live issues.

Combine performance and error monitoring to trace across services
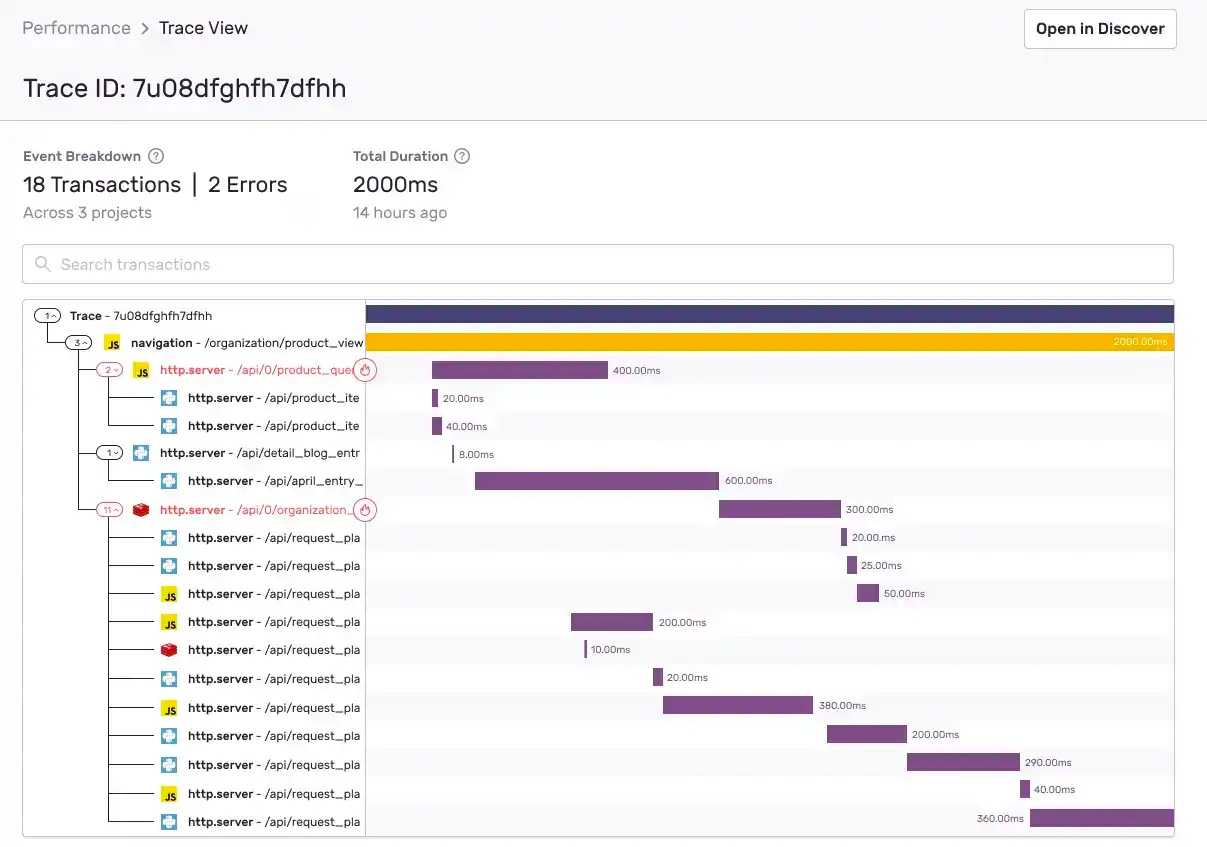
See a unified view of your frontend to backend flow. Trace slow-loading pages all the way back to poor-performing API calls — and surface any related errors — to get to root cause faster.
"Getting started with Sentry and OpenTelemetry was fast and easy. We chose Sentry because we can understand why and where something is slow, fix it quickly, and get ahead of user complaints."
FAQs
The collector approach ultimately removes the Sentry SDKs from the equation, which means you will not get the benefits of advanced error tracking, or any other features Sentry SDKs provide. That includes new product features like profiling and crons. So the approach we decided upon was to treat OTel the same way we treat any other framework. The SDKs can plugin and capture all the relevant data to send to Sentry where we can couple it with all the other features, while getting all insights from your OTel data.
The parent-most OTel span on the OTel span tree that’s created becomes the transaction, and the rest of the spans on the OTel span tree (descendants, branches/leaves) are the spans inside of it.
Yes. Our goal is a flawless conversion of OTel data into Sentry. We do not do some things like automatically set tags. But if you see something amiss, reach out to support, or create an issue for SDK team on one of our repos, we will make sure it is routed to the right place.
A trace represents the record of the entire operation you want to measure or track - like page load, an instance of a user completing some action in your application, or a cron job in your backend. When a trace includes work in multiple services, such as those listed above, it's called a distributed trace, because the trace is distributed across those services.
Each trace consists of one or more tree-like structures called transactions, the nodes of which are called spans. In most cases, each transaction represents a single instance of a service being called, and each span within that transaction represents that service performing a single unit of work, whether calling a function within that service or making a call to a different service. Learn more about distributed tracing.
Looking for an example suite of microservices already instrumented with Sentry and OTel SDKs? We got you covered. Check out our demo repo in Github here. This is a fork of the official example provided by OpenTelemetry we use for our own testing purposed.
A peek at your privacy
Here’s a quick look at how Sentry handles your personal information (PII).
×Who we collect PII from
We collect PII about people browsing our website, users of the Sentry service, prospective customers, and people who otherwise interact with us.
What if my PII is included in data sent to Sentry by a Sentry customer (e.g., someone using Sentry to monitor their app)? In this case you have to contact the Sentry customer (e.g., the maker of the app). We do not control the data that is sent to us through the Sentry service for the purposes of application monitoring.
Am I included?PII we may collect about you
- PII provided by you and related to your
- Account, profile, and login
- Requests and inquiries
- Purchases
- PII collected from your device and usage
- PII collected from third parties (e.g., social media)
How we use your PII
- To operate our site and service
- To protect and improve our site and service
- To provide customer care and support
- To communicate with you
- For other purposes (that we inform you of at collection)
Third parties who receive your PII
We may disclose your PII to the following type of recipients:
- Subsidiaries and other affiliates
- Service providers
- Partners (go-to-market, analytics)
- Third-party platforms (when you connect them to our service)
- Governmental authorities (where necessary)
- An actual or potential buyer
We use cookies (but not for advertising)
- We do not use advertising or targeting cookies
- We use necessary cookies to run and improve our site and service
- You can disable cookies but this can impact your use or access to certain parts of our site and service
Know your rights
You may have the following rights related to your PII:
- Access, correct, and update
- Object to or restrict processing
- Port over
- Opt-out of marketing
- Be forgotten by Sentry
- Withdraw your consent
- Complain about us
If you have any questions or concerns about your privacy at Sentry, please email us at [email protected].
If you are a California resident, see our Supplemental notice.