React Debugging Hub
Learn how to identify and solve the most common bugs and performance issues with our React debugging guide, along with best practices from top React experts. This guide covers debugging client-side React but, if you have a React app that uses server-side rendering, you can also look at our Node.js debugging guide.

React Debugging Guide
In this React debugging guide, we'll show how to create healthy React apps, with minimal bugs and maximal performance. We'll go through some common React errors and performance issues so that you can avoid or fix them. We'll learn React debugging basics using Chrome DevTools, VS Code, and React Developer Tools. We'll also show you how Sentry can be used to log React bugs and performance issues in production to catch problems as they happen.
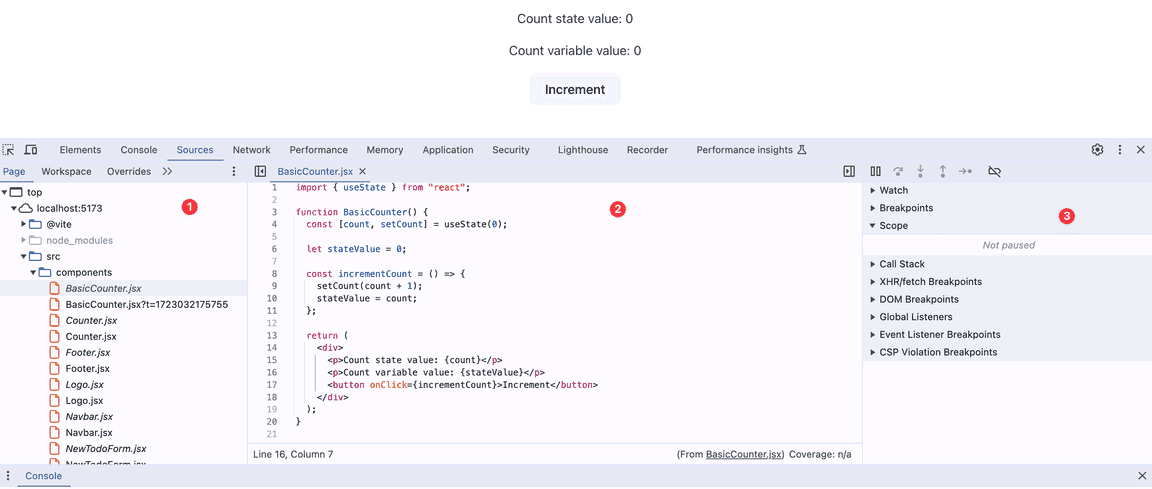
All major browser developer tools include a JavaScript debugger. Access the Chrome DevTools console by pressing the F12 key from the browser. The DevTools Sources panel will open, displaying three sections:
- Page
- Code editor
- Debugger
The Page section shows a file tree of all of the files the page requested. You can select a React component’s file and see the code it contains in the Code editor. The Debugger has tools for inspecting the JavaScript code.
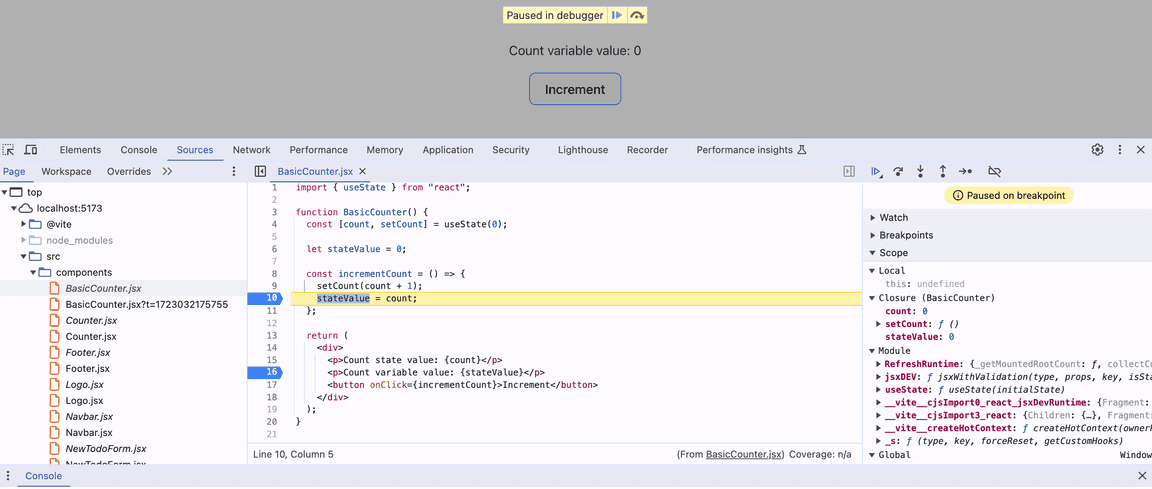
You can add breakpoints in the Code editor by clicking on a line number. You can add conditional breakpoints and log points by right-clicking on a line number and selecting the appropriate item in the popup menu.
Event Listener Breakpoints can be added in the Debugger section. Event Listener Breakpoints are among the many breakpoints available in DevTools to help you debug your apps in different situations. Learn about the various types of breakpoints in the Pause your code with breakpoints article on Chrome for Developers.
Once code execution is paused at a breakpoint, you can see the values of local and global variables at the paused point in the Scope tab of the Debugger section.
Values that are in scope can be referenced in the Console panel at the bottom left of the DevTools window. If you can’t see the Console panel, press the Esc key to display it.
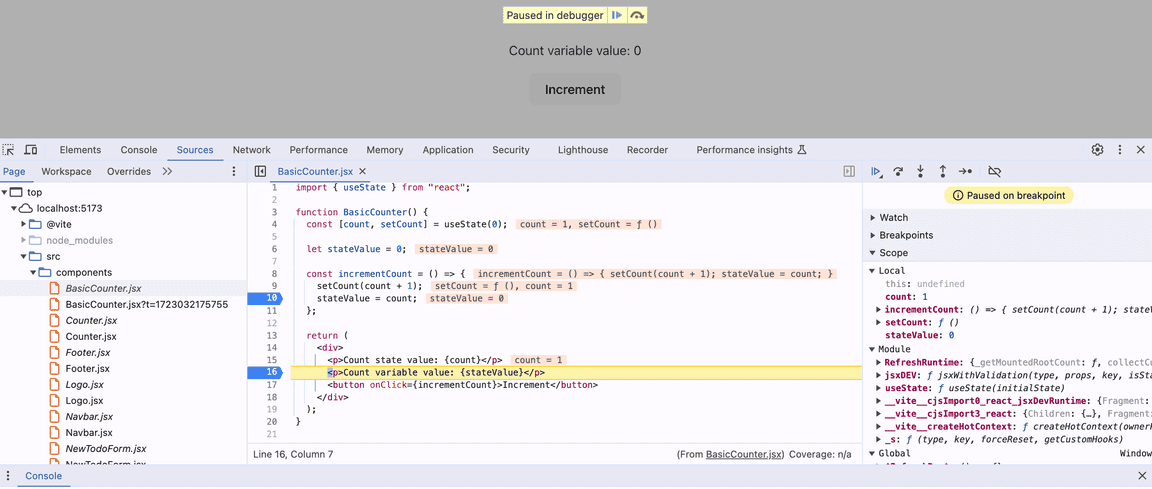
You can also step through the code, using the buttons at the top of the Debugger, one expression at a time to see how the values of variables change. This can help you debug issues.
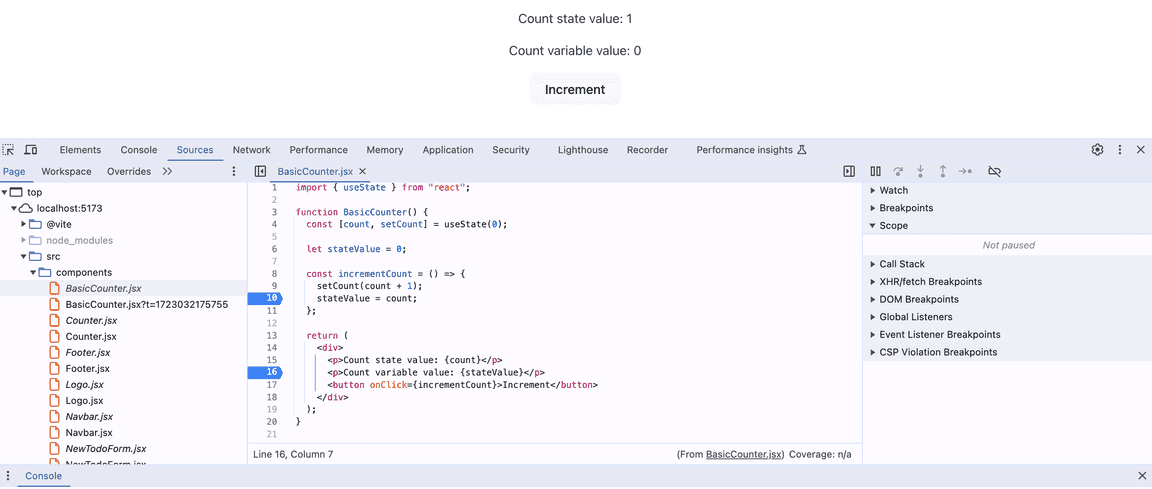
When you click on the “Increment” button of the BasicCounter component in the image below, the stateValue variable does not increase, which may be unexpected as it’s set to the value of the count state in the incrementCount function.
Stepping through the code shows why the stateValue variable remains zero when the “Increment” button is clicked. The stateValue is set to zero each time the component re-renders. The component re-renders when the “Increment” button is clicked because the count state is increased.
Learn more about debugging JavaScript using Chrome DevTools in the Debug JavaScript guide from Chrome for Developers.
There is a limitation to using browser developer tools with React. While you can update state values of a React component using the debugger, it is not recommended because React props and state are immutable and should not be mutated directly. Instead, use React Developer Tools to modify state values and props. We’ll describe how to use React Developer Tools later in this guide.
React Developer Tools helps you to analyze your React app and identify bugs and performance issues. You can inspect React components, edit props and state, and profile performance and rendering.
The easiest way to use React Developer Tools is to install the browser extension, which is available for Chrome, Firefox, and Edge. If you use a different browser, you’ll need to install the react-devtools npm package and follow the instructions for how to use it here. Once you’ve installed the React Developer Tools browser extension, you’ll see two new tabs in your browser developer tools: Components and Profiler.
When using the profiler, make sure to profile the production version of your code so that you can accurately assess your app with minified code and without development-time-only code. The development app will be slower because it’s not minified and it has React code that gives you warnings to help you find code issues. The development code can be multiple times slower than a production build.
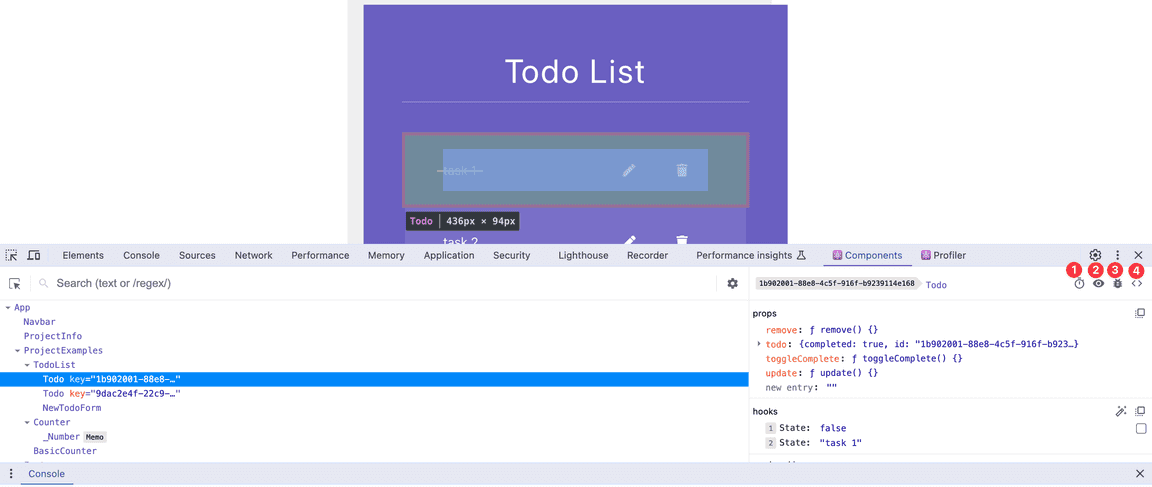
The React Developer Tools Components panel displays the React component tree.
When you click on or hover over a component name, the rendered component will be highlighted on your page. The panel on the right shows the props and state of the selected component. You can edit these values to see how they affect the UI. These values also update when you interact with your app, allowing you to trace a state variable’s value, which can help you debug logic errors.
There are four buttons at the top-right of the right-hand panel as shown in the image above:
- Suspend the selected component if it’s in a Suspense boundary.
- Inspect the matching DOM element.
- Log this component data to the console.
- View the source for this element. Clicking this button opens the Sources panel in your browser developer tools. Here, you can debug your component using the browser debugger or add breakpoints to pause code execution and see how state values change as you interact with your app.
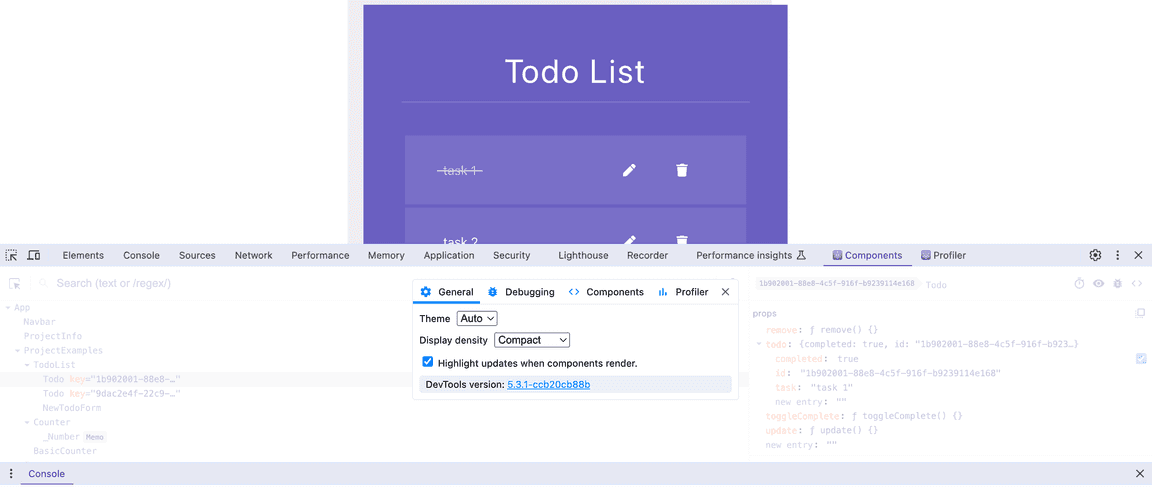
In the Components view, the Settings menu at the top right corner of the left-hand panel provides options for debugging, viewing components, and profiling.
Two default settings you might find useful to change are:
- On the General tab, select the “Highlight updates when components render” checkbox to visualize re-renders better.
- On the Profiler tab, select the “Record why each component rendered while profiling” checkbox to understand why a render occurred.
React Developer Tools can’t always infer the name of a component. For React Context Providers and components wrapped using memo or forwardRef, set the display name property. You can use the “react/display-name” ESLint rule in eslint-plugin-react to ensure each component has a display name.
To see the name of React hook state values, which are named “State” by default, click the “Parse hook names” button to the right of the state values.
The React Profiler collects information about React renders over time and displays it in the Profiler tab of React Developer Tools to help developers identify performance and rendering issues.
To use the profiler for React debugging, click on the round “Start profiling” recording button at the top-left of the Profiler tab. The button is red when profiling is in progress and blue when not. Interact with your application once profiling has started, then click the recording button again to stop profiling and review the collected performance data.
Next to the recording button are buttons to reload and start profiling, clear profiling data, load profile JSON data, and save profile data to a JSON file.
Collected performance information for each render recorded is displayed in three tabs: Flamegraph, Ranked, and Timeline.
The Flamegraph Tab
The bar chart at the top-right of the left-hand panel of the Flamegraph tab visualizes the rendering time for each commit. When a component re-renders, React calculates which DOM node properties have changed. If there has been a change, React applies the changes to the DOM. This is the commit phase of the UI update. Each bar in the graph represents a commit, with the color and height of the bar indicating how long the commit took to render. Yellow bars indicate a longer render time, and green-blue bars indicate a shorter render time.
Click on a bar to see the rendering time for each component in the commit. The width of each horizontal bar represents the duration of the last render for the component. The color of the bar indicates the render time of the current commit. If the component did not re-render during the current commit, the bar will be gray.
You can click on the horizontal component bars to view more information about each component render.
You can use the information in the Flamegraph tab to identify performance bottlenecks caused by issues such as those described in the Common React Performance Issues section above.
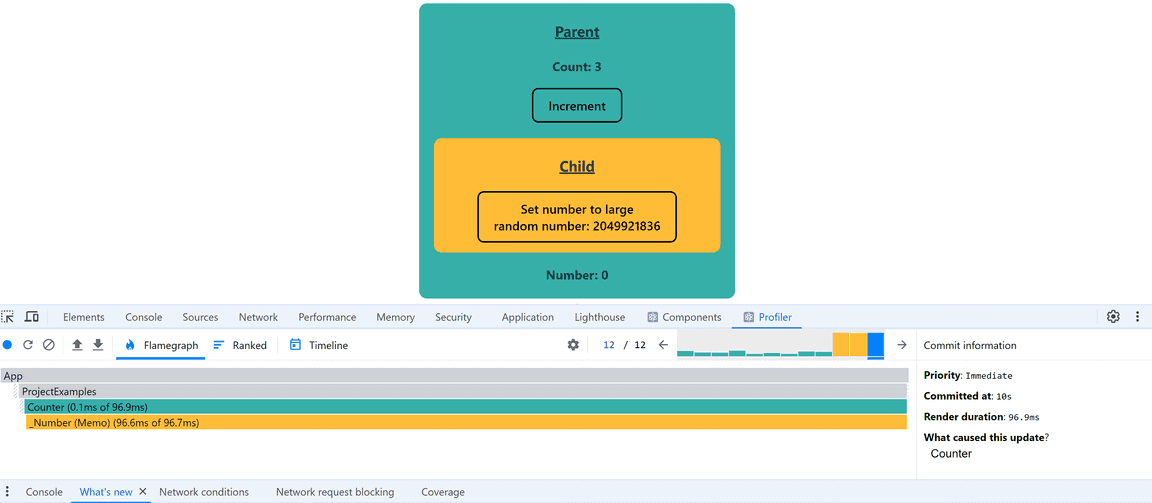
The Flamegraph above shows a parent Count component that passes a function as a prop to the Number component. The Number component performs an expensive calculation on each render. The Number component is memoized, which should prevent it from re-rendering when its props are unchanged. The Flamegraph shows that the Number component re-renders each time that the Count component re-renders. This could cause performance issues.
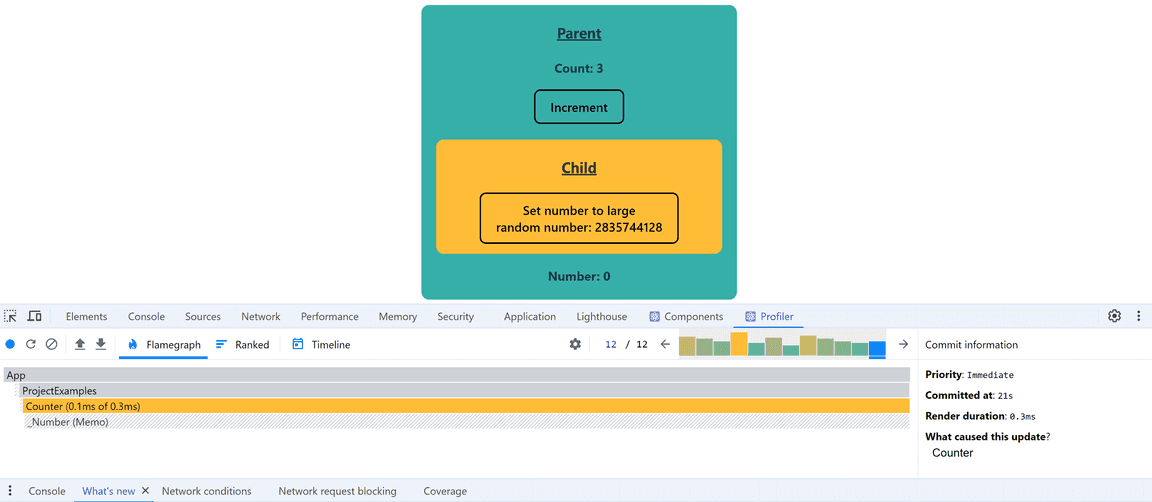
The Flamegraph below shows the Flamegraph after fixing the re-rendering issue by wrapping the function prop with the useCallback hook.
The Number component no longer re-renders when the Count component re-renders. The render times are also much shorter. You can find a more detailed explanation of this issue and its fix in our blog post article, Fixing memoization-breaking re-renders in React.
If your page has many components, you can hide commits with render times below a certain threshold by checking the “Hide commits below” checkbox and setting the value in milliseconds in the Profiler panel within the Settings menu.
The Ranked Tab
Similar to the bar chart in the Flamegraph tab, the bar chart in the Ranked tab visualizes commit rendering times. However, in the Ranked tab, the horizontal bars are ordered by the time taken to render.
The Timeline Tab
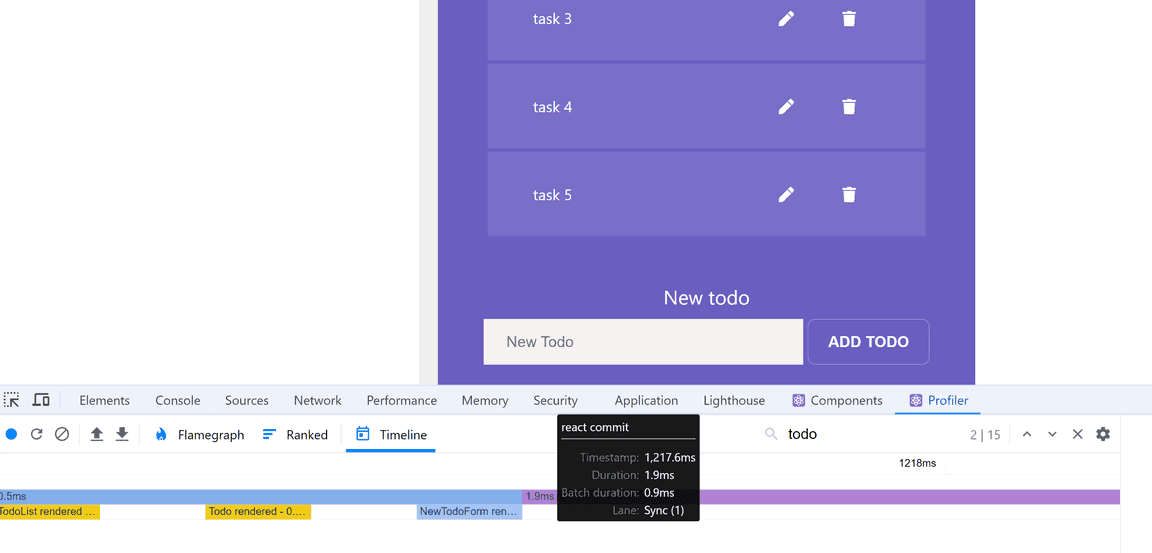
The Timeline tab shows when commits occurred during profiling.
You can filter the Timeline view by component using the “Search components by name” input at the top-right of the timeline.
To use the React Developer Tools Profiler in a production build of your app, you need a production profiling bundle. It’s available in the react-dom dependency in the profiling folder. You can learn how to use this bundle by following this guide: How to use profiling in production mode for react-dom.
If your React app uses Vite, you can add the following properties to your vite.config.js file:
resolve: { alias: [ { find: /^react-dom$/, replacement: "react-dom/profiling" }, { find: "scheduler/tracing", replacement: "scheduler/tracing-profiling" }, ], }, esbuild: { minifyIdentifiers: false, keepNames: true, }
The esbuild configuration prevents the component names from being minified, which prevents the component names from being scrambled in the production build.
Common React performance issues include:
- Loading unnecessary code.
- Excessive re-rendering.
- Expensive calculations causing components to render slowly.
- Rendering large lists of data.
- Unnecessary data fetching when data can be cached, paginated, or lazy-loaded.
- Memory leaks in
useEffect.
A common cause of performance issues is loading unnecessary code. For example, if your React app uses a large library, such as a charting library, that does not need to be used on page load, you can improve the page load speed by loading the library only when it’s needed. You can do this with the JavaScript dynamic import. From React 16, you can lazy-load components using Suspense. You may find the Chrome DevTools Coverage panel useful for finding unused JavaScript code.
Unnecessary re-renders of components can cause performance issues. Re-renders are triggered by a state change. When a component re-renders, its descendent components re-render too so that the application UI is in sync with the React state. Because of this, don’t put state higher in the tree than is necessary.
If you have a pure component that always renders the same UI when given the same props, you can exclude it from re-renders when a parent component re-renders by wrapping it in memo. React will only re-render the memoized component if its props change.
On each render, all elements defined inside the component, such as objects and functions, are re-created. You can use the useMemo hook to cache the result of expensive calculations between re-renders. Use the useCallback to cache function definitions.
Memoization is often not necessary. It may improve performance if a component has a lot of descendants, if the component performs computationally expensive calculations, or for applications with lots of interactivity, like a drawing editor that allows you to move shapes about. It can also be useful to memoize a large object passed into the value attribute of a context provider. Before you use memo, check if you can split the troublesome components into parts that can change and parts that won’t change.
React re-renders are often not a problem. If you notice performance issues in your app, you can use the React Developer Tools Profiler tab to determine if the re-renders are a performance issue. We’ll learn about React Developer Tools in the next section.
Note that the React team is in the process of creating the React Compiler, which will auto-memoize code. Once the compiler is released, you may not need to use useMemo, useCallback, or memo anymore.
Another common performance issue occurs when rendering a very long list of items. React is good at efficiently updating the DOM but it will be slow if there are thousands of DOM nodes to add or update. To improve performance when rendering long lists, calculate which items need to be added to the DOM as the user interacts with the page and only add those necessary nodes. This process is called list virtualization, and you can use a library like TanStack Virtual to render large lists efficiently.
React Debugging Tips
Website Performance Tips
React Experts
React Newsletters
All React Answers
- >GitHub Dependabot alert: `nth-check is vulnerable to Inefficient Regular Expression Complexity`
- >Component State Should Always be Initialized Fully
- >Avoid re-rendering by using uncontrolled inputs
- >Why don't React Router URLs work when refreshing or writing manually?
- >Window is not Defined
- >The data grid component requires all rows to have a unique `id` property
- >Why can't the React.js onClick event pass a value to a method?
- >React: ResizeObserver loop completed with undelivered notifications
- >How do I Conditionally add Attributes to React Components?
- >What is the difference between React Native and React?
Considered “not bad” by 4 million developers and more than 100,000 organizations worldwide, Sentry provides code-level observability to many of the world’s best-known companies like Disney, Peloton, Cloudflare, Eventbrite, Slack, Supercell, and Rockstar Games. Each month we process billions of exceptions from the most popular products on the internet.
A peek at your privacy
Here’s a quick look at how Sentry handles your personal information (PII).
×Who we collect PII from
We collect PII about people browsing our website, users of the Sentry service, prospective customers, and people who otherwise interact with us.
What if my PII is included in data sent to Sentry by a Sentry customer (e.g., someone using Sentry to monitor their app)? In this case you have to contact the Sentry customer (e.g., the maker of the app). We do not control the data that is sent to us through the Sentry service for the purposes of application monitoring.
Am I included?PII we may collect about you
- PII provided by you and related to your
- Account, profile, and login
- Requests and inquiries
- Purchases
- PII collected from your device and usage
- PII collected from third parties (e.g., social media)
How we use your PII
- To operate our site and service
- To protect and improve our site and service
- To provide customer care and support
- To communicate with you
- For other purposes (that we inform you of at collection)
Third parties who receive your PII
We may disclose your PII to the following type of recipients:
- Subsidiaries and other affiliates
- Service providers
- Partners (go-to-market, analytics)
- Third-party platforms (when you connect them to our service)
- Governmental authorities (where necessary)
- An actual or potential buyer
We use cookies (but not for advertising)
- We do not use advertising or targeting cookies
- We use necessary cookies to run and improve our site and service
- You can disable cookies but this can impact your use or access to certain parts of our site and service
Know your rights
You may have the following rights related to your PII:
- Access, correct, and update
- Object to or restrict processing
- Port over
- Opt-out of marketing
- Be forgotten by Sentry
- Withdraw your consent
- Complain about us
If you have any questions or concerns about your privacy at Sentry, please email us at [email protected].
If you are a California resident, see our Supplemental notice.
